AKS Monitoring with Azure Monitor and Grafana
Project Overview
This project demonstrates how to monitor an Azure Kubernetes Service (AKS) cluster using Azure Monitor and Grafana.
The monitoring pipeline includes:
- Azure Kubernetes Service (AKS)
- Azure Log Analytics Workspace
- Azure Monitor
- Grafana deployed inside Kubernetes using Helm
- Azure Monitor datasource connected to Grafana
The result is a complete observability dashboard for the AKS cluster showing:
- CPU usage
- Memory utilization
- Node metrics
- Pod metrics
- Namespace usage
- Disk and network metrics
This project simulates a real DevOps monitoring workflow used in production environments.
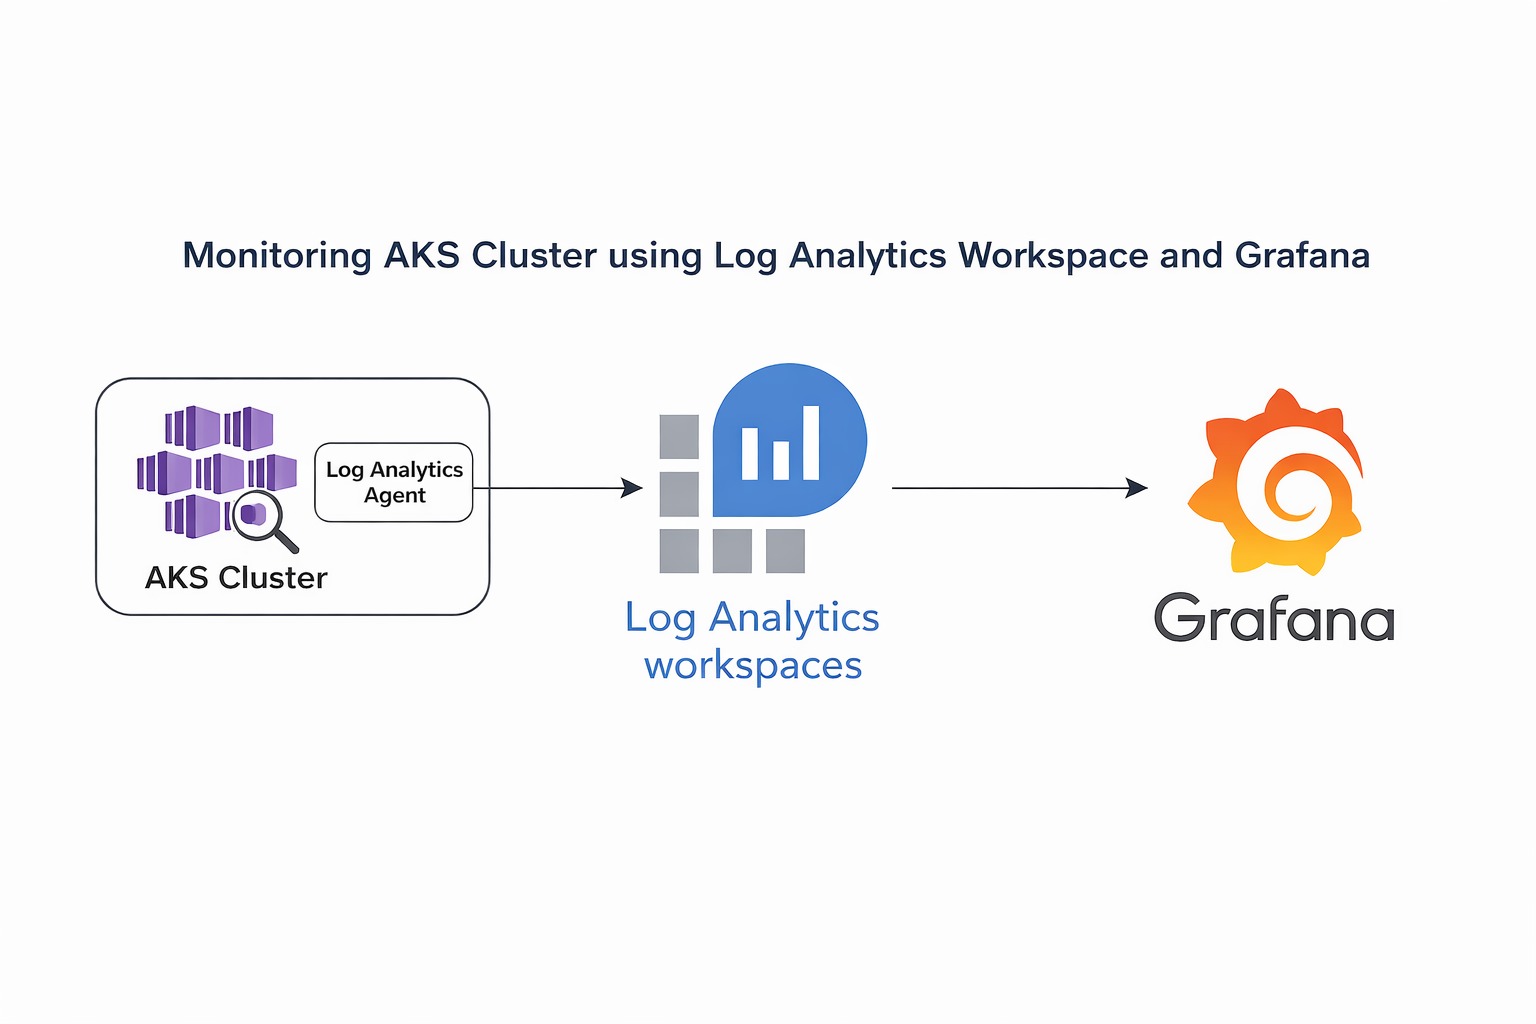
Architecture
The monitoring architecture works as follows:
AKS Cluster → Azure Monitor Add-on → Log Analytics Workspace → Grafana → Dashboards
Azure Monitor collects metrics from the AKS cluster and stores them in
Log Analytics Workspace.
Grafana queries these metrics through Azure Monitor API and
visualizes them in dashboards.
Technologies Used
- Azure Kubernetes Service (AKS) – Managed Kubernetes service on Azure
- Azure Monitor – Azure native monitoring service
- Log Analytics Workspace – Storage for logs and metrics
- Grafana – Visualization and monitoring dashboard tool
- Helm – Kubernetes package manager
- kubectl – Kubernetes command line tool
- Azure CLI – Command line interface for Azure
What is Azure Log Analytics Workspace?
Azure Log Analytics workspace is a central storage location for logs and monitoring data collected by Azure Monitor.
It collects logs from different Azure resources such as:
- Virtual Machines
- Azure Kubernetes Service
- Azure App Services
- Containers
You can think of the workspace as a database that stores monitoring metrics and logs which can later be queried and visualized.
What is Grafana?
Grafana is an open-source analytics and visualization platform.
It allows users to:
- Query metrics from different data sources
- Build monitoring dashboards
- Visualize system metrics
- Set alerts
- Monitor infrastructure in real time
In this project Grafana connects to Azure Monitor to visualize AKS metrics.
Prerequisites
Before starting ensure the following:
- Azure Subscription
- Azure CLI installed
- kubectl installed
- Helm installed
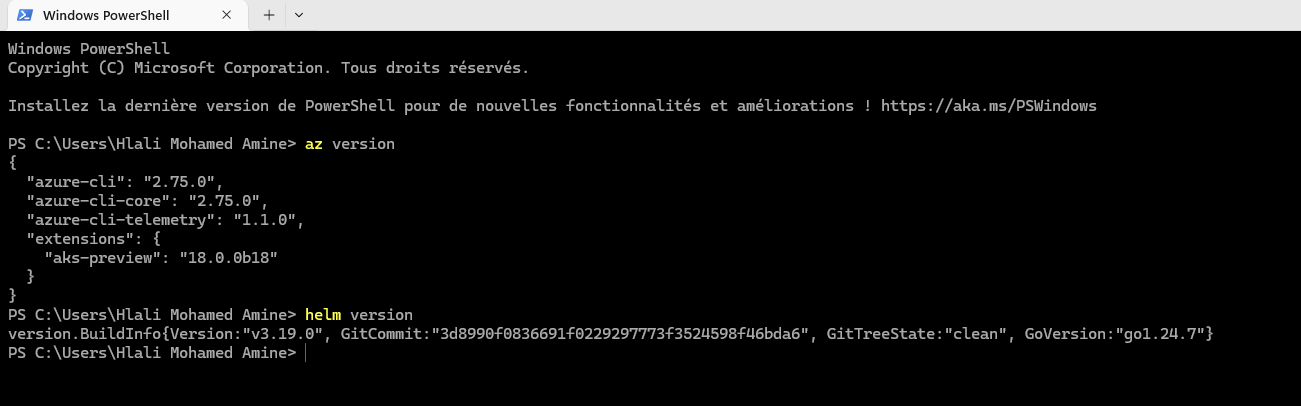
Check versions:
az version
helm versionExample:
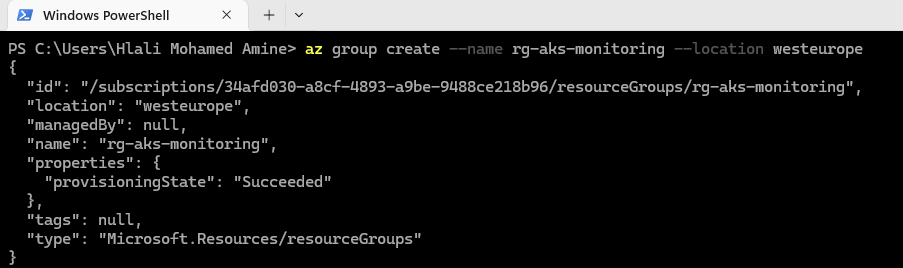
Step 1 — Create Resource Group
A resource group is a container that holds all Azure resources for this project.
az group create --name rg-aks-monitoring --location westeuropeExample output:
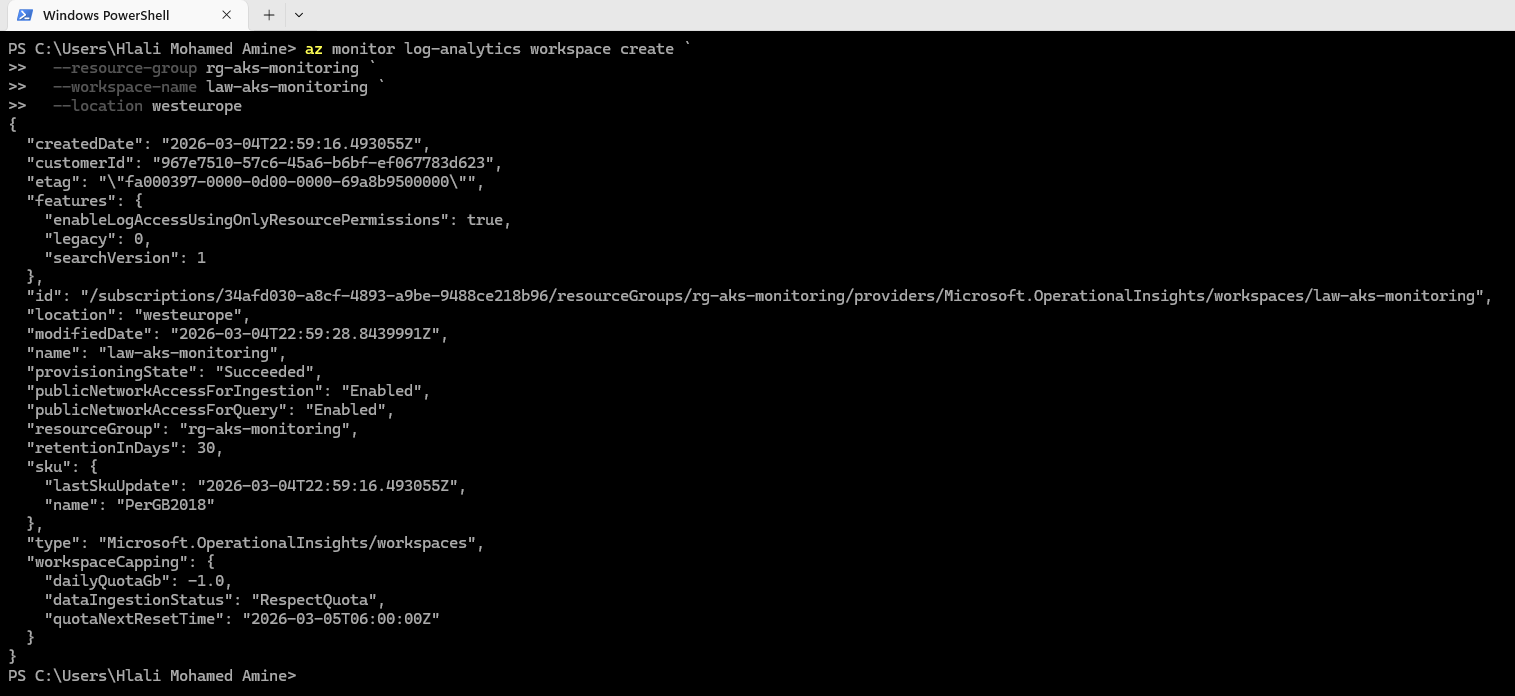
Step 2 — Create Log Analytics Workspace
Create a Log Analytics workspace to store monitoring logs.
az monitor log-analytics workspace create --resource-group rg-aks-monitoring --workspace-name law-aks-monitoring --location westeuropeExample result:
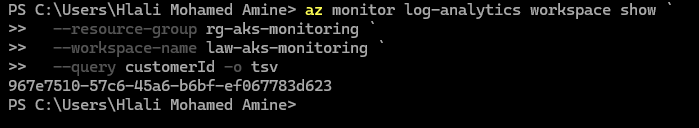
Step 3 — Get Workspace Customer ID
Retrieve the workspace ID which will be used by Azure Monitor.
az monitor log-analytics workspace show --resource-group rg-aks-monitoring --workspace-name law-aks-monitoring --query customerId -o tsvExample:
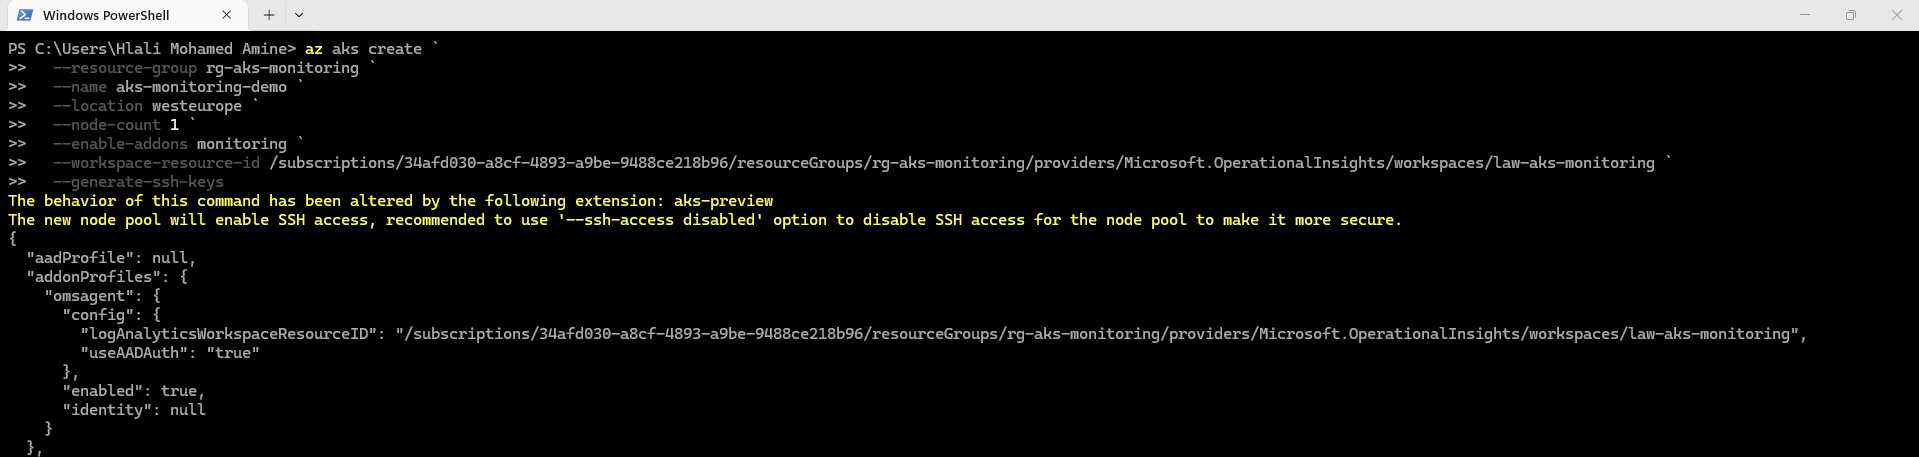
Step 4 — Create AKS Cluster
Create an AKS cluster and enable the Azure Monitor add-on.
az aks create --resource-group rg-aks-monitoring --name aks-monitoring-demo --location westeurope --node-count 1 --enable-addons monitoring --workspace-resource-id <workspace_id> --generate-ssh-keysExample deployment:
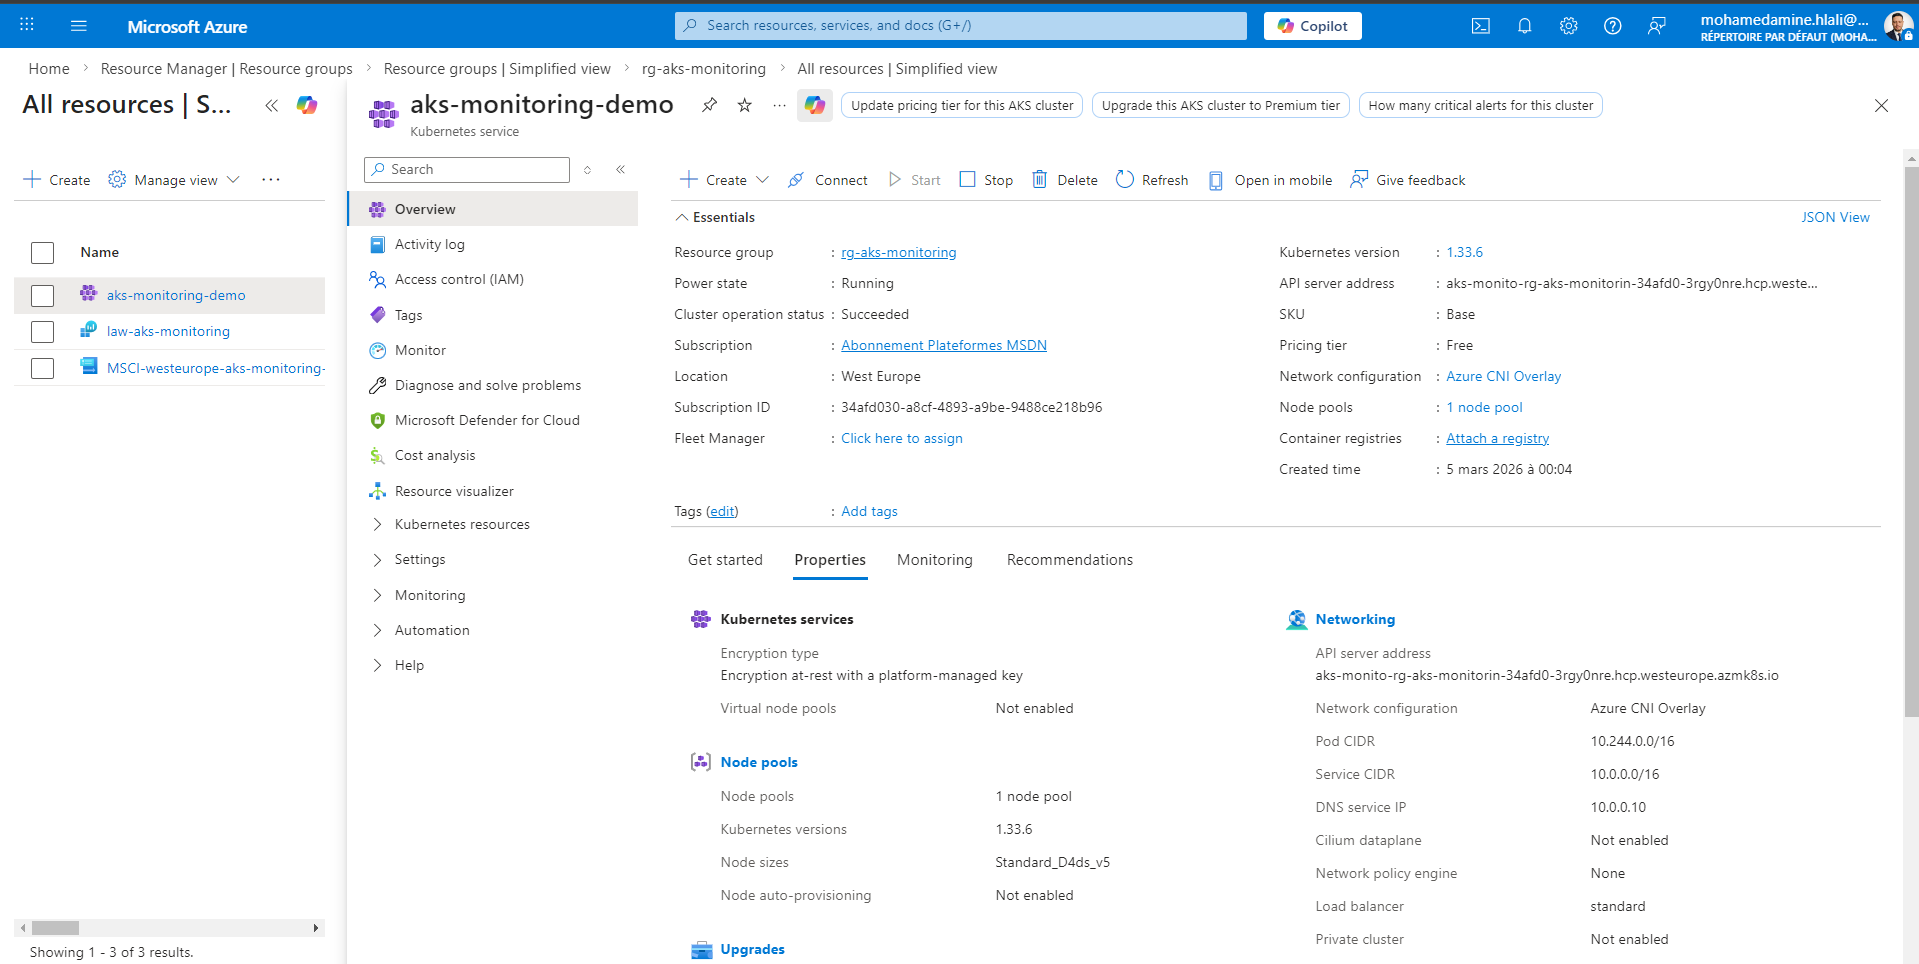
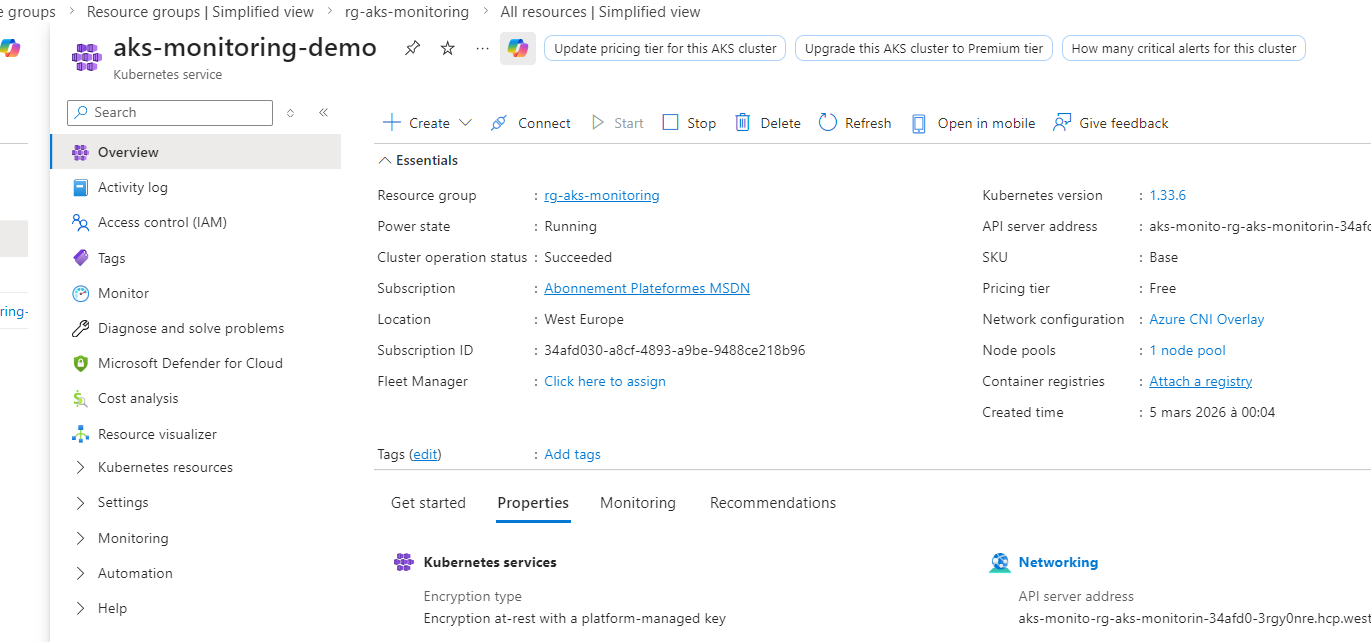
Step 5 — Verify AKS in Azure Portal
After deployment the cluster should appear in Azure Portal.
Step 6 — Connect to AKS Cluster
Download Kubernetes credentials and connect to the cluster.
az aks get-credentials --resource-group rg-aks-monitoring --name aks-monitoring-demoVerify nodes:
kubectl get nodesExample:
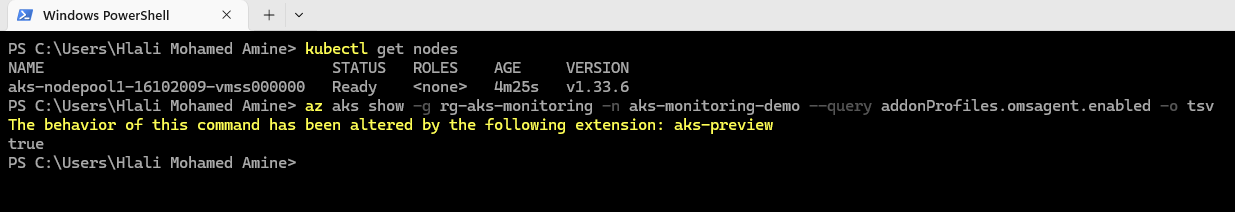
Step 7 — Verify Monitoring Add-on
Ensure Azure Monitor is enabled.
az aks show -g rg-aks-monitoring -n aks-monitoring-demo --query addonProfiles.omsagent.enabled -o tsvExpected output:
true
Example:
Step 8 — Install Grafana using Helm
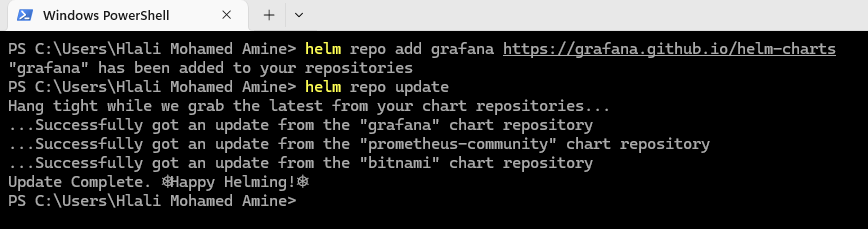
Add Grafana Helm repository.
helm repo add grafana https://grafana.github.io/helm-charts
helm repo updateExample:
Step 9 — Create Monitoring Namespace
Create a Kubernetes namespace for monitoring tools.
kubectl create namespace monitoring
kubectl get nsExample:
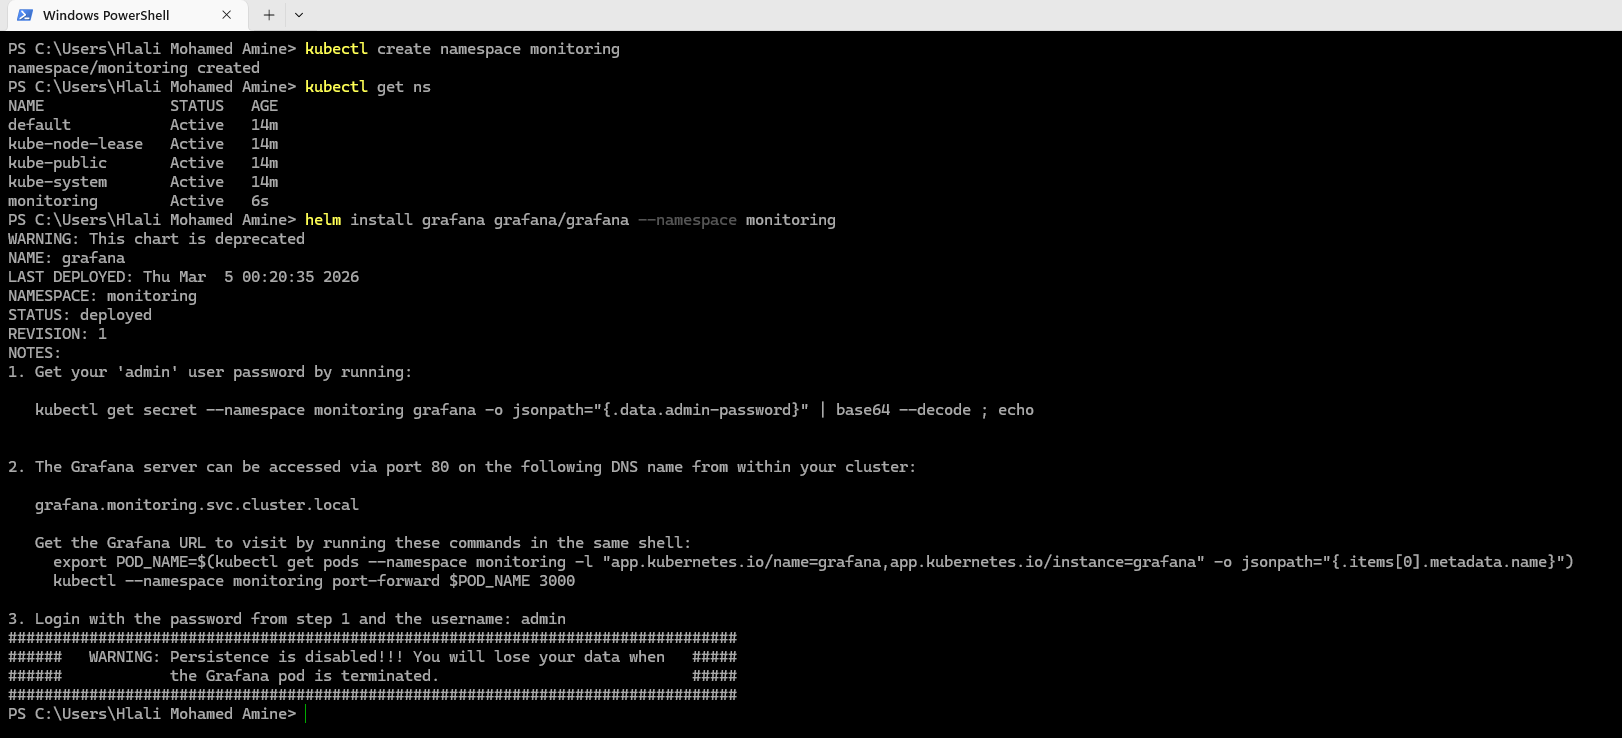
Step 10 — Install Grafana
Deploy Grafana using Helm.
helm install grafana grafana/grafana --namespace monitoringExample:
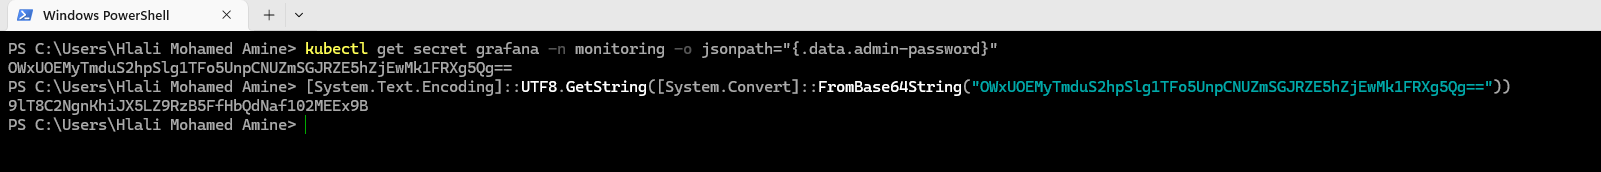
Step 11 — Retrieve Grafana Password
Retrieve the admin password from Kubernetes secret.
kubectl get secret grafana -n monitoring -o jsonpath="{.data.admin-password}"Decode Base64 password.
Example:
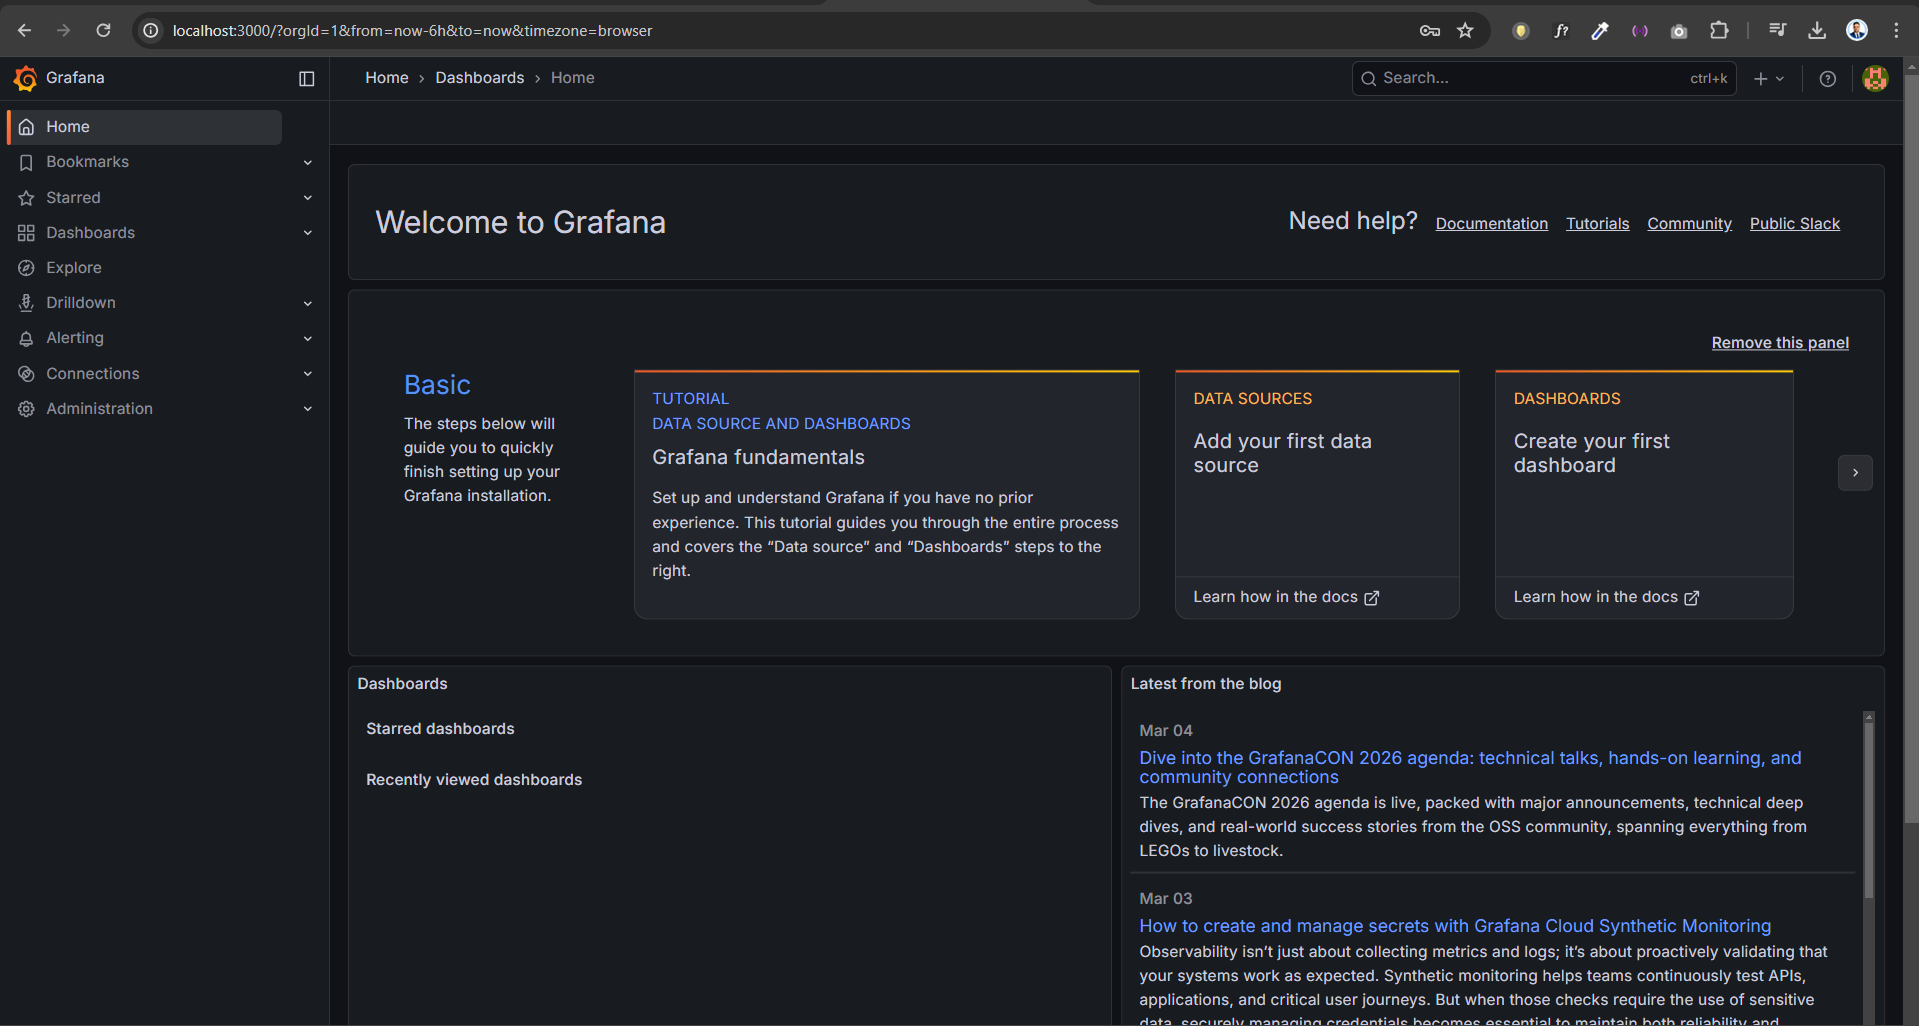
Step 12 — Access Grafana
Expose Grafana locally.
kubectl port-forward -n monitoring svc/grafana 3000:80Open browser:
http://localhost:3000
Example:
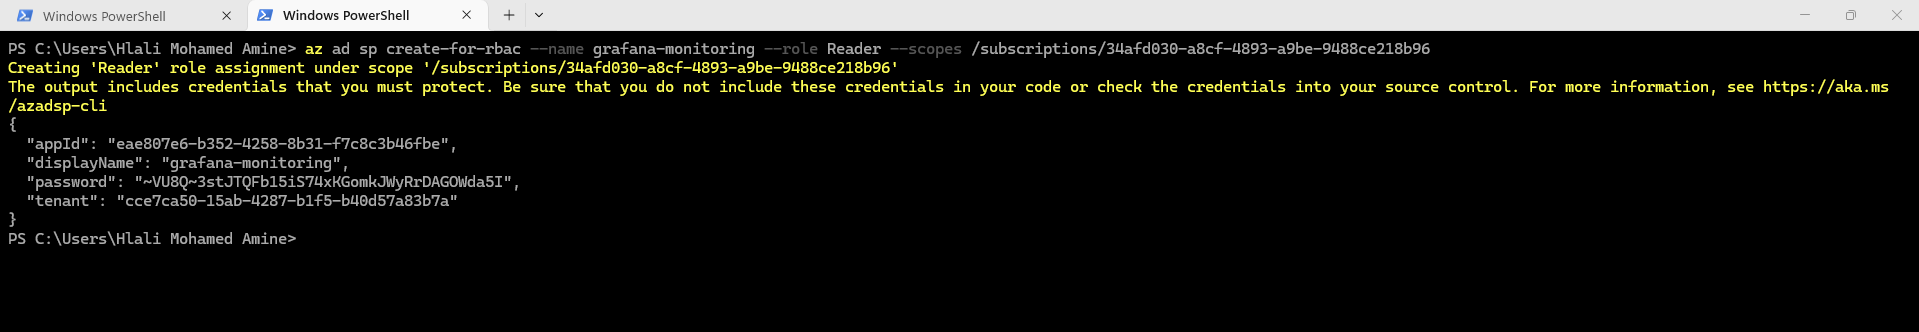
Step 13 — Create Azure Service Principal
Create a service principal for Grafana authentication.
az ad sp create-for-rbac --name grafana-monitoring --role Reader --scopes /subscriptions/<subscription_id>Example:
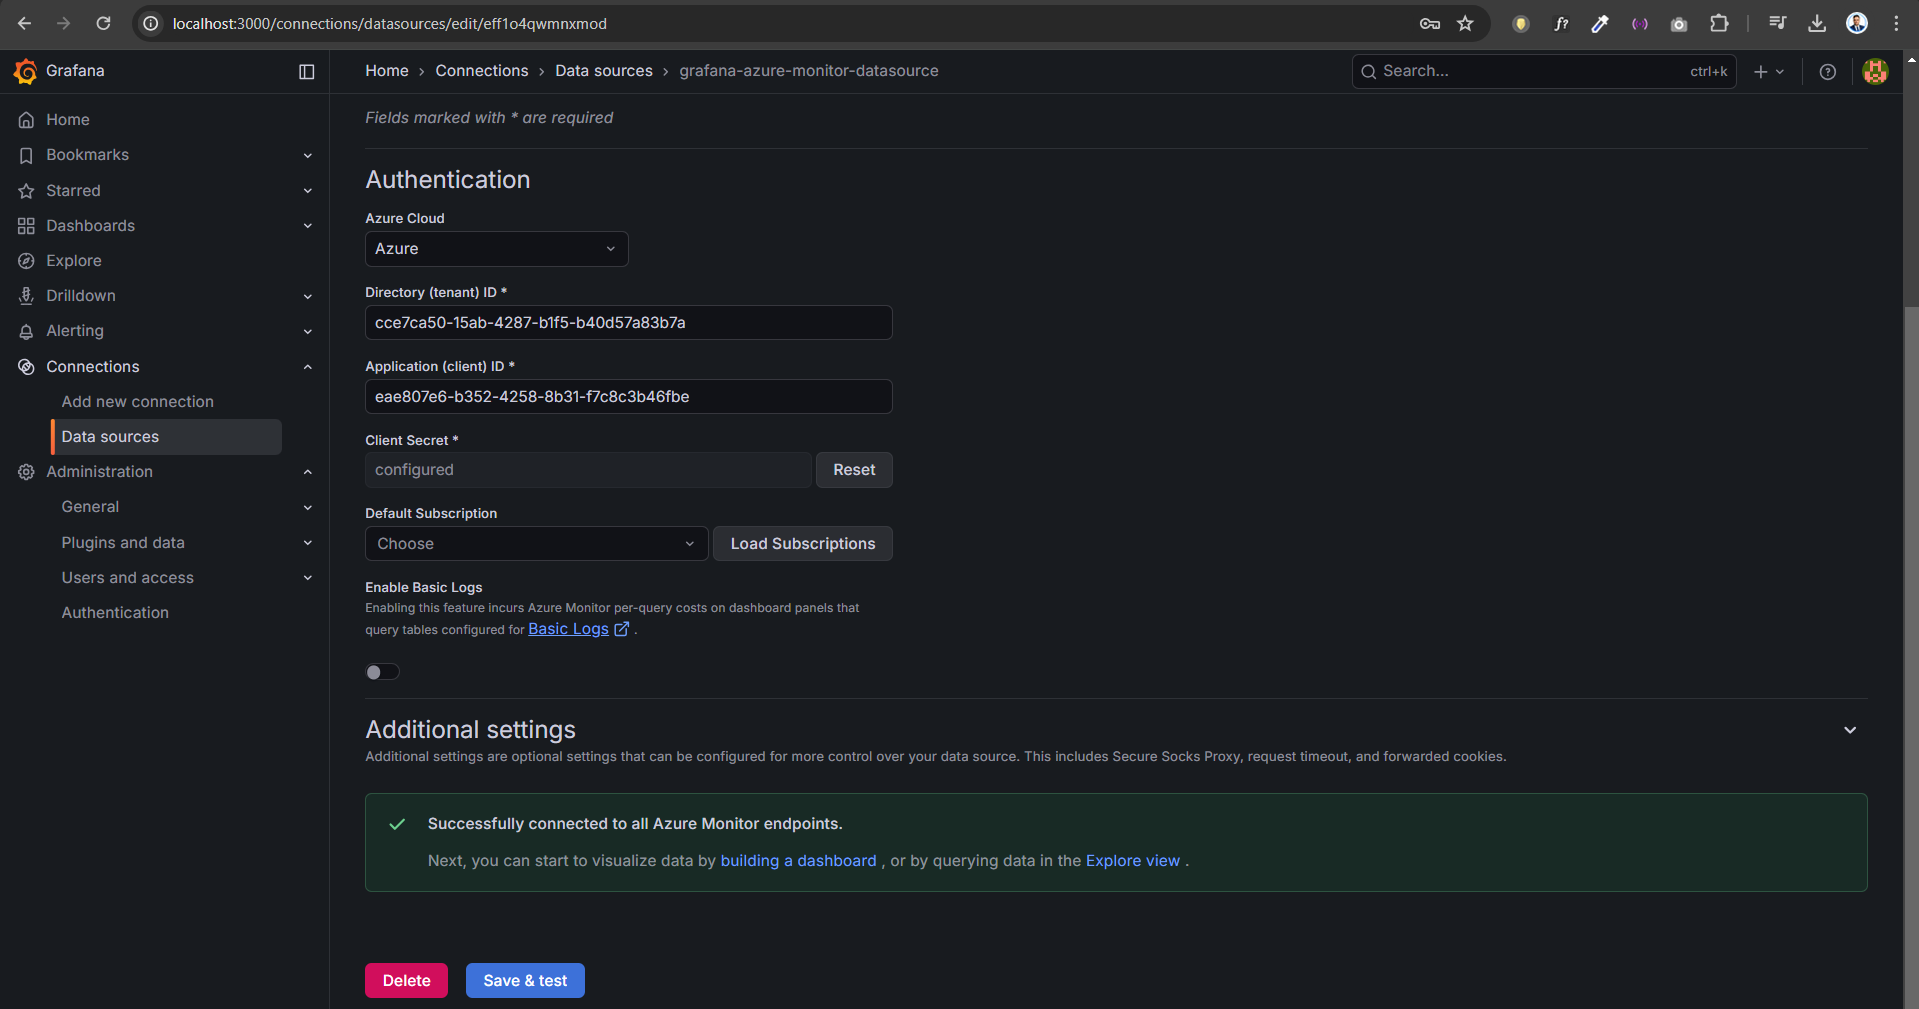
Step 14 — Configure Azure Monitor Datasource
In Grafana go to:
Connections → Data Sources → Azure Monitor
Enter:
- Tenant ID
- Client ID
- Client Secret
Successful connection:
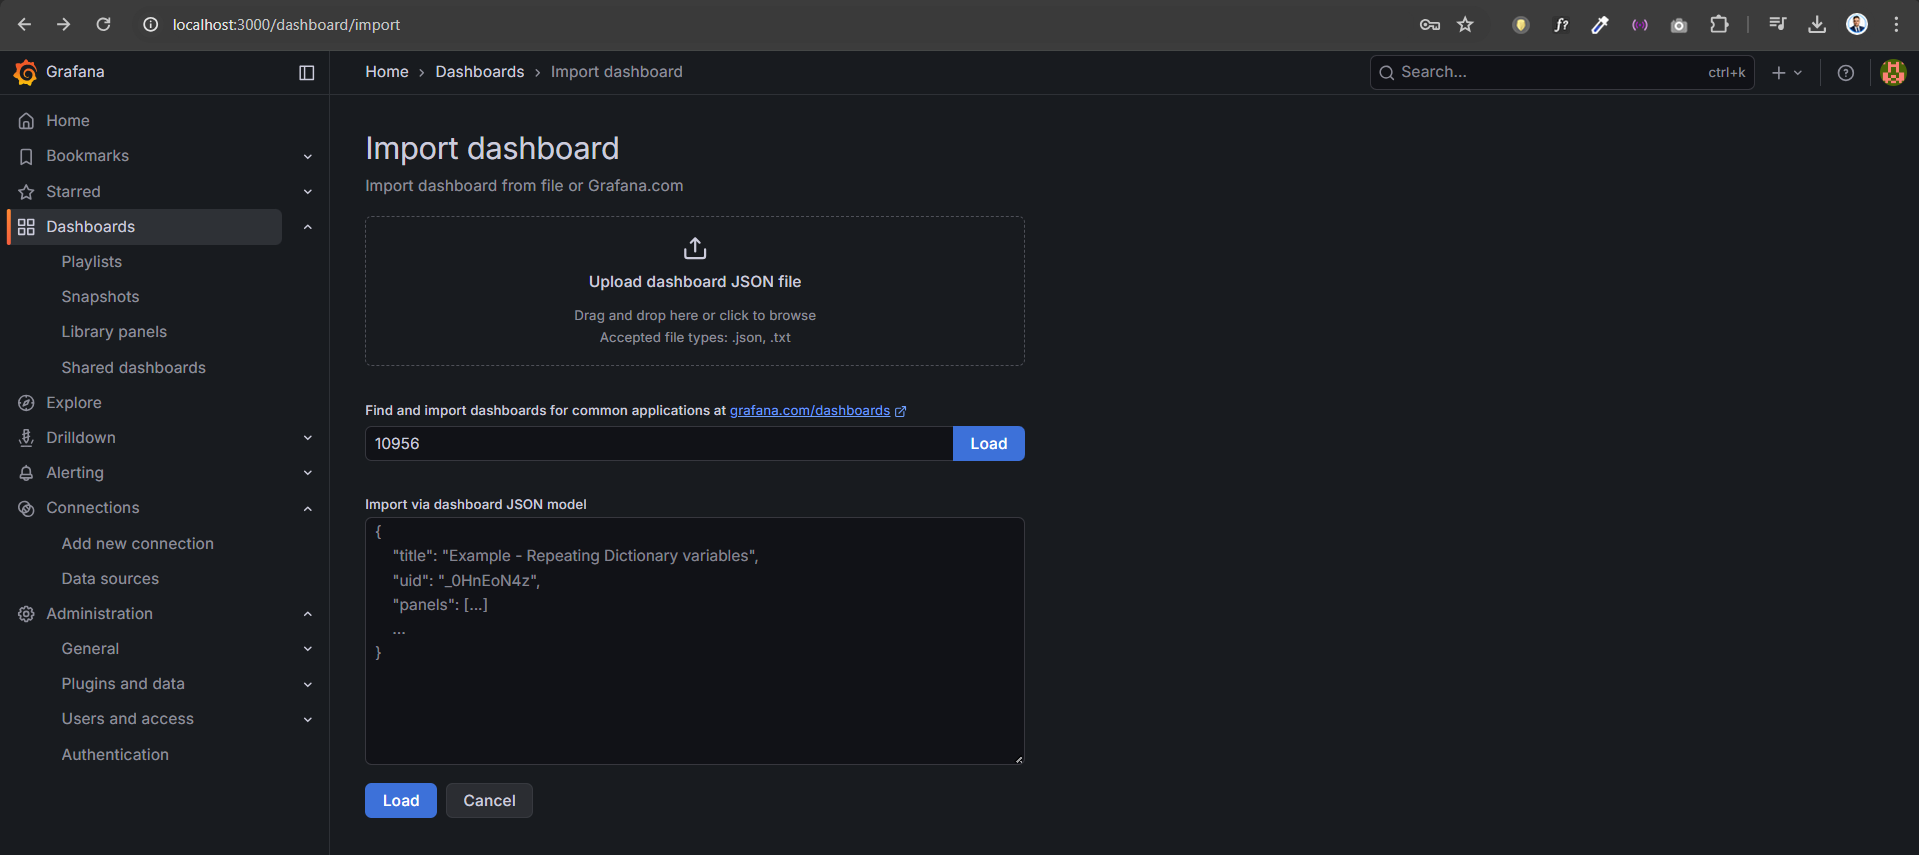
Step 15 — Import Grafana Dashboard
Import the Azure Monitor dashboard.
Dashboard ID:
10956
Example:
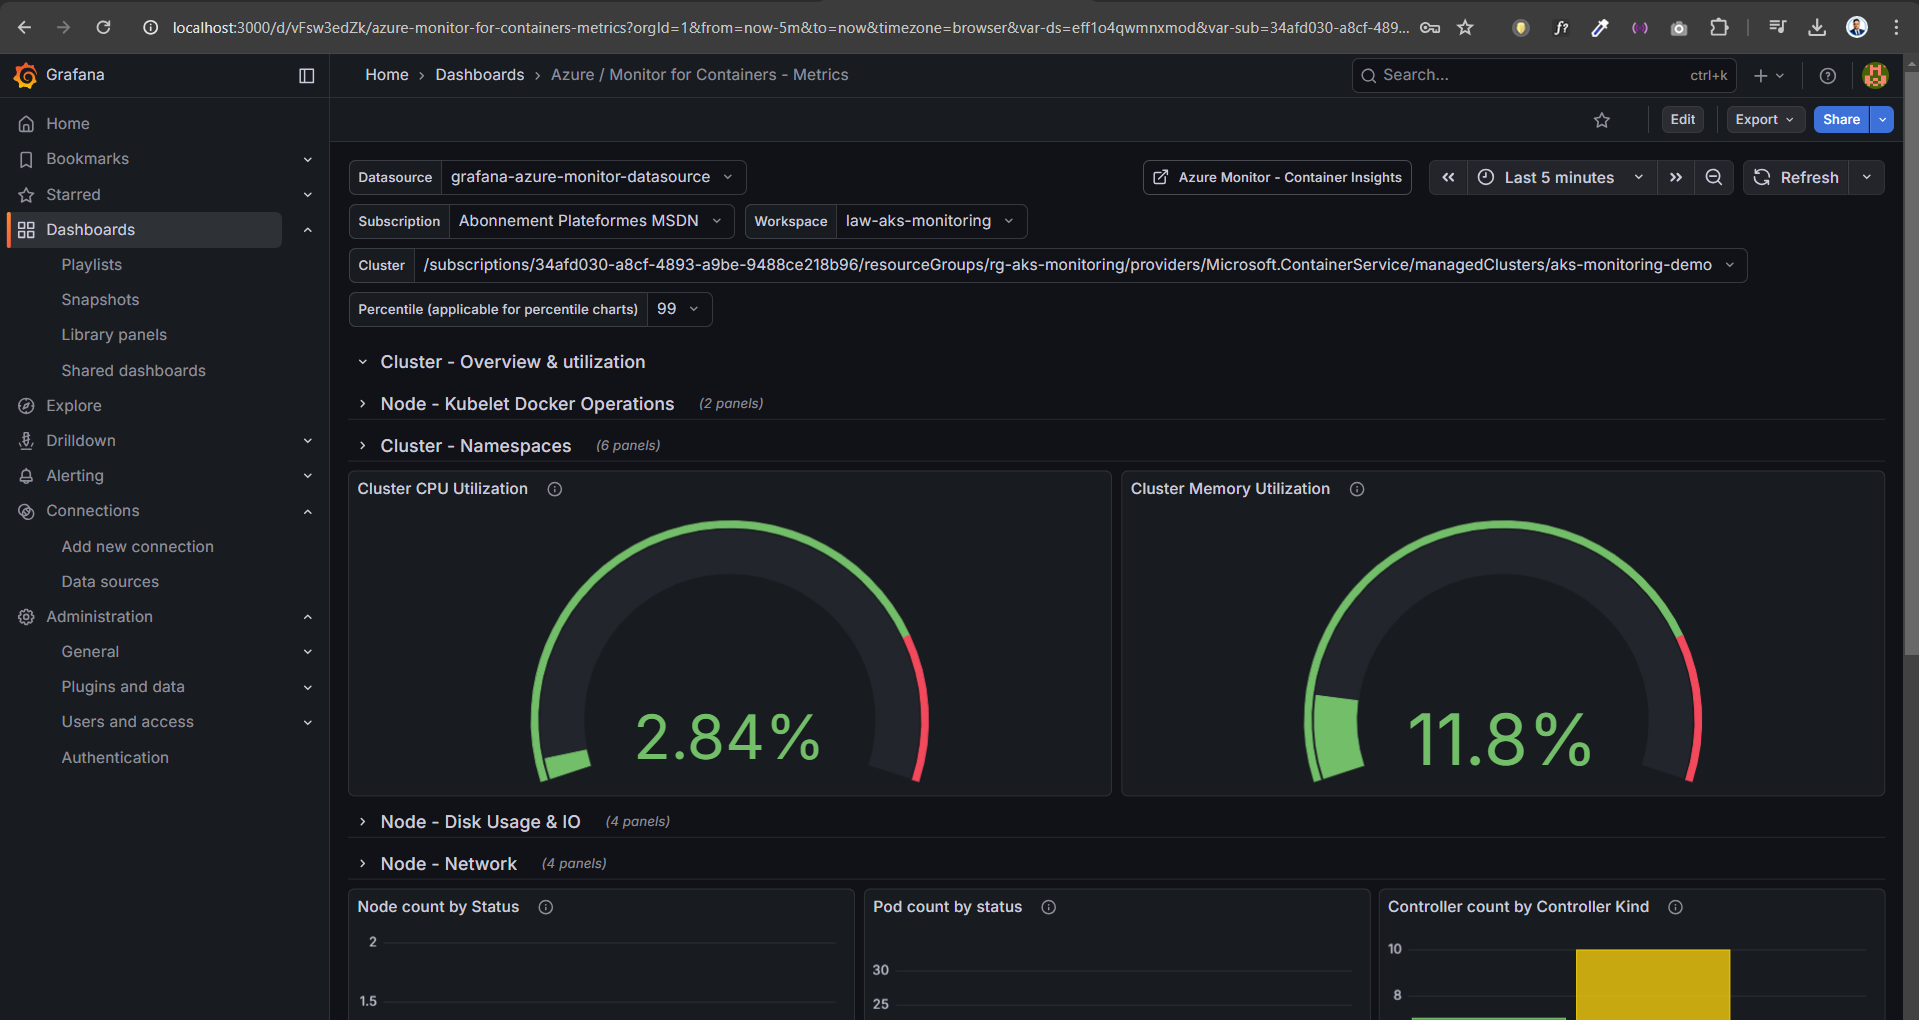
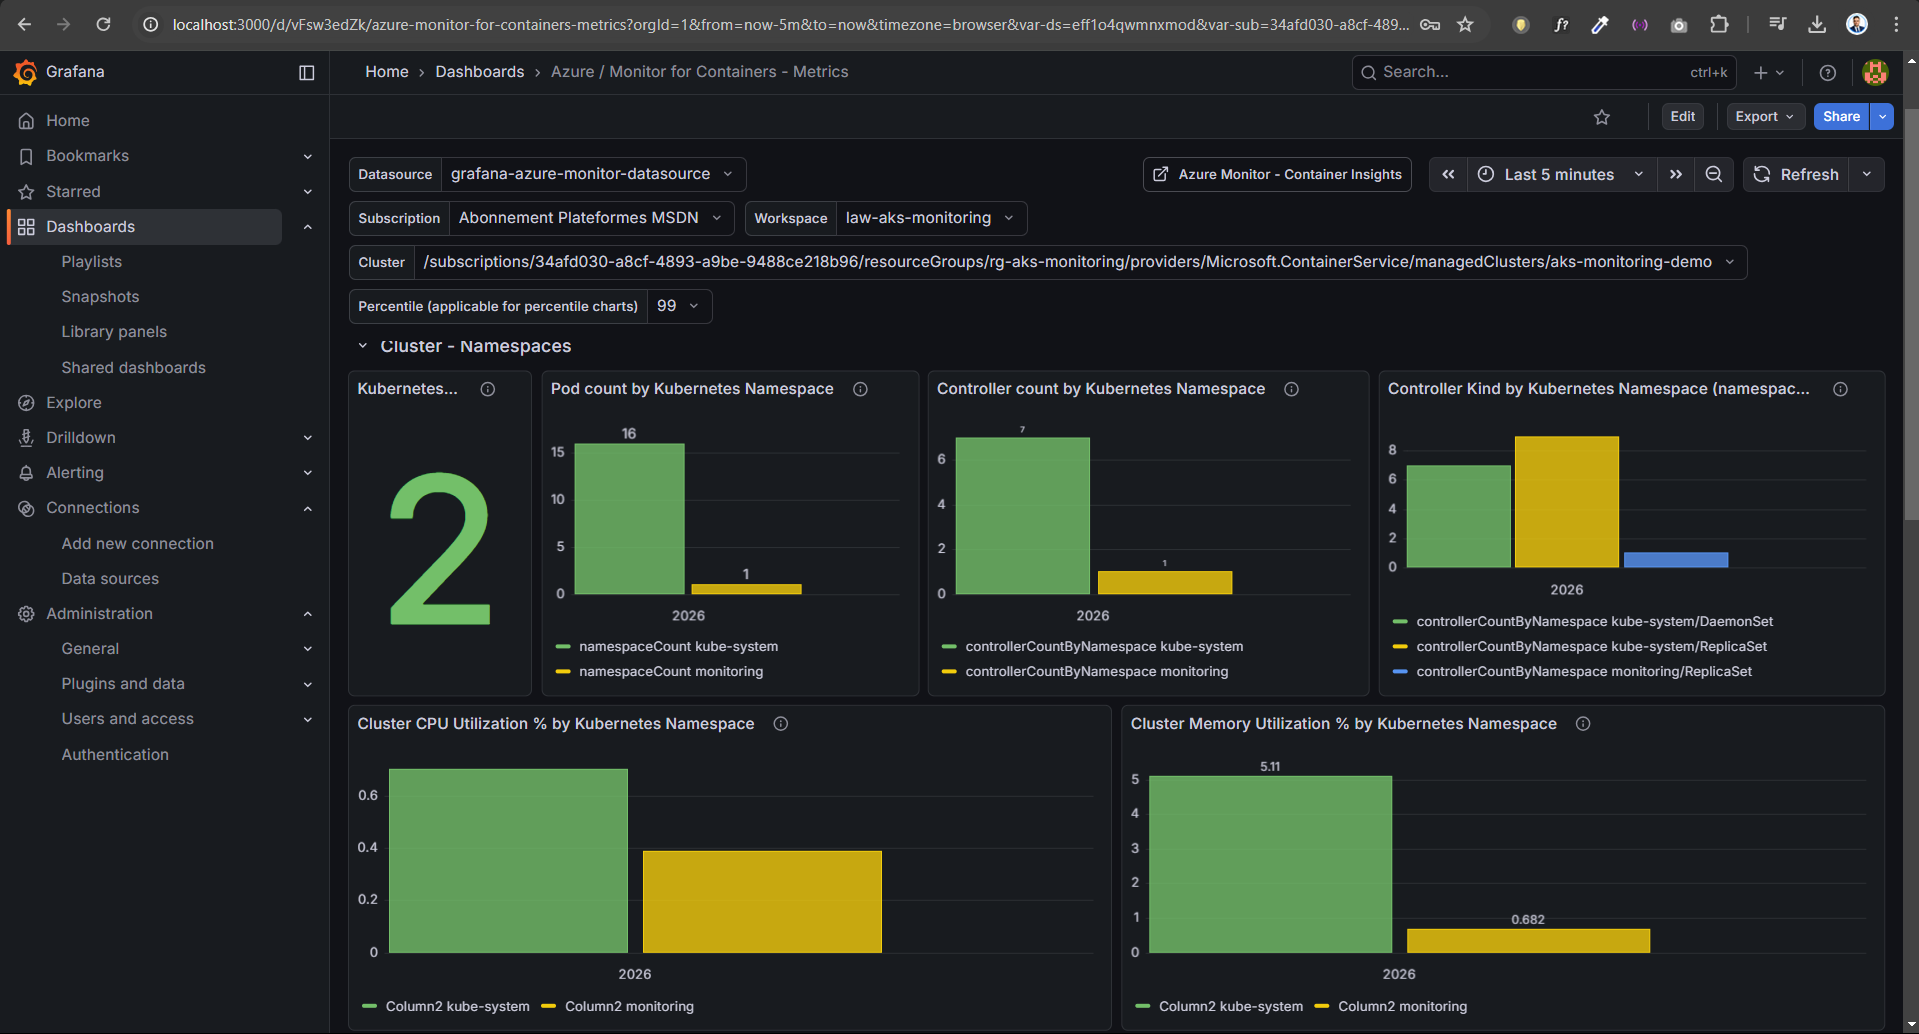
View AKS Monitoring Dashboard
Once imported, Grafana displays metrics including:
- CPU utilization
- Memory usage
- Node metrics
- Pod statistics
- Namespace metrics
- Disk and network metrics
Example dashboard:
Cleanup Resources
To avoid Azure charges delete the resource group.
az group delete --name rg-aks-monitoring --yes --no-wait